
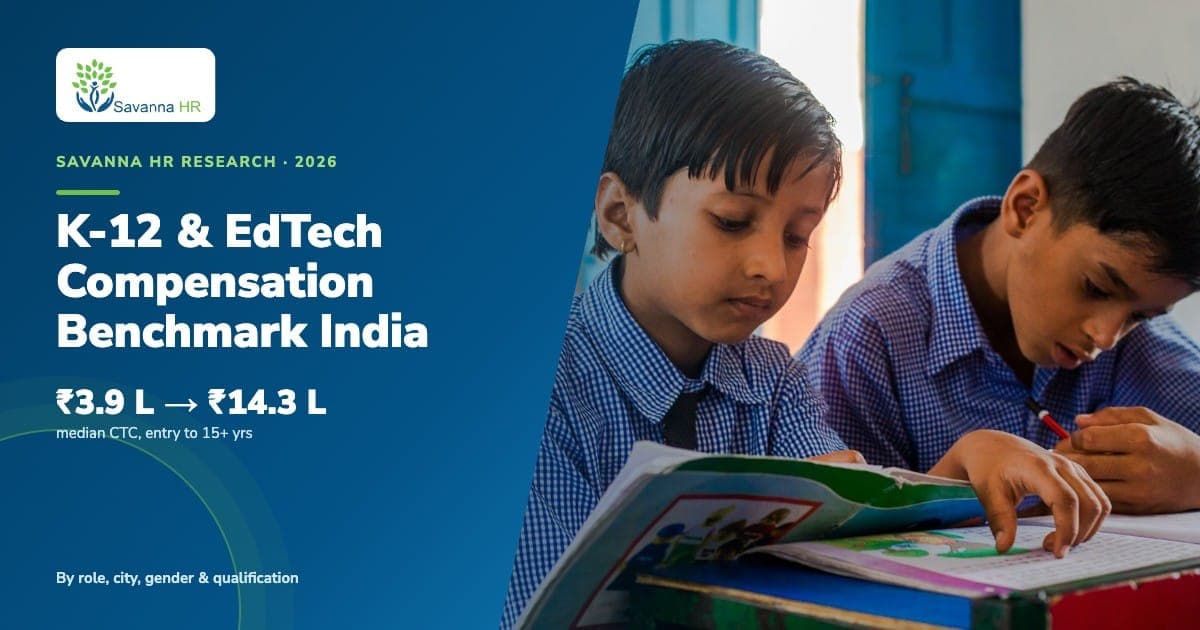
Quick answer: Median CTC in India's EdTech and K-12 sector is ₹3.9 lakh at 0–2 years, ₹6 lakh at 3–7 years, ₹9 lakh at 8–14 years and ₹14.3 lakh at 15+ years. Engineers and product managers with 8–14 years earn ₹24.5–27 lakh, about three times peers in sales, HR or content. Women earn 20–24% less than men at the same experience. Based on 2.8 lakh+ candidate profiles and records, 2017–2026.
Source: Savanna HR Research. Savanna HR's proprietary talent pool and leading job-board databases. Figures are estimates of the typical market range, not exact values.
Key findings
- 2.8 lakh+: EdTech and K-12 profiles and records analysed. 1 in 4 active EdTech professionals is in Delhi NCR, 1 in 6 in Bengaluru.
- 3.7×: Pay growth from entry to leadership: median ₹3.9L at 0–2 years, ₹6L at 3–7, ₹9L at 8–14 and ₹14.3L at 15+.
- 20% · 4.4% · 1.1%: Share of the workforce earning ₹10L+, ₹25L+ and ₹50L+.
- ₹24.5–27L: Median pay of engineers and product managers with 8–14 years, about 3× peers in sales, content or HR.
- 59%: Share of ₹25L+ earners who live in Delhi NCR or Bengaluru.
- 2×: Rise in median pay of school and EdTech sales professionals: ₹5.5L (2017–19) to ₹11L (2025–26).
- 48% → 21%: Women's share falls at every step: 48% at entry, 37% at 8–14 years, 27% at 15+ and 21% of the ₹50L+ tier.
- 1.7×: Median pay of MBA/PGDM holders (₹9.5L) over other graduates (₹5.5L).
- ₹10.8L: Mumbai's median CTC, the highest of any city. Tier 1 cities pay 1.2–1.4× the rest, and 2.1× at senior level.
- 86%: Active EdTech professionals who can join within a month; only 66% of ₹25L+ earners can.
- 65%: Share of candidates whose expected CTC fits employers' budgets (55% for the strongest, shortlisted candidates).
- ~3%: Share of job-switchers who cite pay as the main reason to move.
How we built this benchmark
One combined dataset, read as a whole: current-market profiles, historical candidate records and hiring data across 2017–2026.
Our K-12 Compensation Benchmark pulled together public pay data for schools, school-solution companies and B2C EdTech. This edition answers what readers asked next: how many people work in the sector, where they sit, how fast pay grows, how women fare, what a degree is worth and who earns at the top.
| Item | Detail |
|---|---|
| Profiles and records analysed | 2.8 lakh+ candidate profiles and records, 2017–2026 |
| Sources | Savanna HR's proprietary talent pool and leading job-board databases, combined into one dataset |
| Current-market view | Professionals active in the last six months |
| Breakdowns | Experience, function, city, gender, education, notice period, salary band, expected CTC |
| Deep-dives | Mid-level (3–7 yrs), senior (8+ yrs), ₹25L+ and ₹50L+ earners |
| Accuracy | Estimates of the typical market range, not exact values; smaller cuts are indicative |
Definitions
- CTC is self-reported annual cost to company, in ₹ lakh. Values below ₹0.6L or above ₹150L, and figures quoted in crore, were removed.
- Experience bands: entry 0–2 years, mid 3–7, senior 8–14, leadership 15+.
- Tier 1 = Bengaluru, Delhi NCR (Delhi, Noida, Gurugram, Ghaziabad), Mumbai, Hyderabad, Pune, Chennai, Kolkata.
- Hike asked = (expected CTC ÷ current CTC) − 1.
- Medians are used throughout. We report only aggregates; no individual, client or candidate is identified.
The EdTech workforce in 2026
India's EdTech and K-12 solutions workforce is young and sales-heavy: seven in ten active professionals have seven years' experience or less, and only one in thirteen has 15 years or more.
By function (share of active professionals)
| Function | Share |
|---|---|
| Sales & business development | 22% |
| Teaching & training | 11.9% |
| Customer success & operations | 9.5% |
| Engineering (software, QA) | 7.3% |
| Marketing & communications | 5.6% |
| Human resources | 4.9% |
| Data science & analytics | 4% |
| Content & editorial | 2.8% |
| Finance & accounting | 2.7% |
| Product management | 1.3% |
| Strategic & top management | 1% |
By experience
| Experience | Share |
|---|---|
| 0–2 years | 28% |
| 3–7 years | 43% |
| 8–14 years | 21% |
| 15+ years | 8% |
Women are 44.5% of the active workforce where gender is stated.
What it means: sales and customer-facing roles make up almost a third of the workforce, but product, data and top-management roles, together under 7%, set the pay ceiling. Senior product or data hiring draws on a national pool of a few thousand people.
Where the talent is
Delhi NCR (Delhi, Noida, Gurugram, Ghaziabad) holds 25% of the EdTech workforce, against Bengaluru's 16.5%. Nine Tier 1 cities account for about 63% of all EdTech professionals.
Share of active EdTech professionals by city, top 20
| City | Share |
|---|---|
| Bengaluru | 16.5% |
| New Delhi | 12.3% |
| Hyderabad | 7.5% |
| Noida | 6.8% |
| Mumbai | 5.8% |
| Gurugram | 5.3% |
| Pune | 4.6% |
| Chennai | 4.0% |
| Kolkata | 3.8% |
| Lucknow | 1.6% |
| Jaipur | 1.1% |
| Indore | 1.1% |
| Patna | 1.0% |
| Coimbatore | 1.0% |
| Nagpur | 0.9% |
| Ahmedabad | 0.8% |
| Ghaziabad | 0.8% |
| Bhopal | 0.7% |
| Chandigarh | 0.6% |
| Bhubaneswar | 0.6% |
The Tier 2 story: Lucknow, Jaipur, Indore, Patna, Coimbatore and Nagpur each hold about 1–1.6% of the workforce. These are the cities where school-sales, academic-counselling and teacher-training roles are hired locally; Patna and Lucknow reflect the test-prep and vernacular-learning boom in the Hindi belt.
For employers: field-sales and school-implementation teams in Tier 2 cities can be built from local talent; product, data and leadership teams realistically have to be hired in Bengaluru or NCR, or relocated.
Pay across the career
Median pay rises from ₹3.9L at entry to ₹9L at 8–14 years, a 2.3× rise, then spreads out: at 15+ years the median is ₹14.3L but the top 10% earn ₹40L or more.
Median CTC by experience
| Experience | Median CTC | Middle half (P25–P75) |
|---|---|---|
| Entry (0–2 yrs) | ₹3.9L | ₹3–5.2L |
| Mid (3–7 yrs) | ₹6L | ₹4.5–8L |
| Senior (8–14 yrs) | ₹9L | ₹6–12L |
| Leadership (15+ yrs) | ₹14.3L | ₹9.7–22.5L · top 10% ₹40L+ |
What candidates earn and ask
| Experience | Median current CTC | Median hike asked |
|---|---|---|
| 0–2 years | ₹5.0L | 35% |
| 3–5 years | ₹6.6L | 33% |
| 6–9 years | ₹9.0L | 28% |
| 10–14 years | ₹10.8L | 26% |
| 15+ years | ₹11.0L | 29% |
Candidates with both current and expected CTC, 2024–26.
- Early years pay off fastest. The jump from entry to mid-level (+54%) is larger than any later step, and young candidates ask for the biggest hikes (33–35%).
- The 10-year plateau. Median current CTC barely moves between 10–14 and 15+ years (₹10.8L vs ₹11.0L). Experience alone stops paying; role scope does.
- Leadership is a different market. The jump to ₹25L+ comes from moving into business, product or P&L ownership, not tenure in the same function.
Pay by function
Function matters as much as experience: at 8–14 years, engineers (₹24.5L) and product managers (₹27L) earn about 3× their peers in sales (₹10L), HR (₹7.5L) or content (₹7L).
Median CTC at 8–14 years of experience
| Function | Median CTC | Middle half (P25–P75) |
|---|---|---|
| Product management | ₹27L | ₹11–42L |
| Engineering (software, QA) | ₹24.5L | ₹12–36L |
| Strategic & top management | ₹24.5L | ₹15–32L |
| Sales & business dev. | ₹10L | ₹6–12L |
| Human resources | ₹7.5L | ₹5.5–12.1L |
| Data science & analytics | ₹7L | ₹6–12.6L |
| Content & editorial | ₹7L | ₹4.5–10.7L |
| Finance & accounting | ₹7L | ₹4.5–10L |
| Marketing & comms | ₹6.8L | ₹5.4–11.4L |
| Customer success & ops | ₹6.6L | ₹4.2–8.6L |
| Teaching & training | ₹3.5L | ₹2–6L |
Medians by function and career stage
| Function | Mid median (3–7) | Mid top 10% | Senior median (8–14) | Leadership median (15+) | Top 10% (8+) |
|---|---|---|---|---|---|
| Strategic & top management | ₹14.0L | ₹34L+ | ₹24.5L | ₹27.5L | ₹50L+ |
| Product management | ₹8.0L | ₹18L+ | ₹27.0L | – | ₹53L+ |
| Engineering (software, QA) | ₹8.4L | ₹16L+ | ₹24.5L | ₹35.0L | ₹48L+ |
| Data science & analytics | ₹6.3L | ₹13L+ | ₹7.0L | ₹16.0L | ₹24L+ |
| Sales & business development | ₹5.5L | ₹8L+ | ₹10.0L | – | ₹17L+ |
| Human resources | ₹5.5L | ₹8.7L+ | ₹7.5L | ₹14.4L | ₹20L+ |
| Marketing & communications | ₹5.1L | ₹10L+ | ₹6.8L | ₹13.2L | ₹24L+ |
| Customer success & operations | ₹4.6L | ₹10L+ | ₹6.6L | ₹8.7L | ₹15L+ |
| Finance & accounting | ₹4.2L | ₹8L+ | ₹7.0L | – | ₹17L+ |
| Content & editorial | ₹4.0L | ₹7L+ | ₹7.0L | ₹6.5L | ₹15L+ |
| Teaching & training | ₹3.6L | ₹8L+ | ₹3.5L | ₹3.5L | ₹9L+ |
A dash means too few profiles for a reliable median. Treat function-level cells as indicative.
- Two pay worlds. Engineering, product and top management sit in a ₹25–30L senior market; every other function's senior median is ₹6.6–10L. One EdTech pay band cannot cover both.
- Sales is the escalator for customer-facing roles. It starts low but climbs fastest outside tech, to ₹10L at 8–14 years with a top 10% above ₹17L.
- Data, HR and marketing pay off late. Their senior medians are modest (₹6.8–7.5L), but leaders with 15+ years reach ₹13–16L.
- Teaching is the flattest. Teachers and trainers in EdTech companies earn a median ₹3.5L at every level; moving into academic leadership, content or training roles is the route up.
Where the jump happens. In engineering and product, median pay roughly triples between the mid band (₹8–8.4L) and 8–14 years (₹24.5–27L). In sales it roughly doubles; in content, HR, marketing and operations it rises only 25–75%. Senior professionals in Tier 1 cities earn a median ₹11.5L against ₹5.4L elsewhere (2.1×).
Gender: representation and pay
Women are 48% of EdTech professionals with up to two years' experience, 27% at 15+ years and one in five in the ₹50L+ tier; at the same experience they earn 20–24% less than men.
Women's share by career stage
| Career stage | Women's share |
|---|---|
| Entry 0–2 yrs | 48% |
| Mid 3–7 yrs | 45% |
| Senior 8–14 yrs | 37% |
| Leadership 15+ yrs | 27% |
| ₹50L+ earners | 21% |
Parity would be 50%.
Median CTC at the same experience
| Experience | Women | Men | Gap |
|---|---|---|---|
| Mid 3–7 yrs | ₹5.0L | ₹6.5L | −23% |
| Senior 8–14 yrs | ₹8.0L | ₹10.0L | −20% |
| Leadership 15+ yrs | ₹12.0L | ₹15.8L | −24% |
Gaps are unadjusted for function.
- Function mix. Women are concentrated in teaching, academic counselling, content and HR, which pay less at every level than sales, product and technology.
- The mid-career drop. Women's share falls fastest between the mid (45%) and senior (37%) bands, the years when people move into P&L, regional-sales and product roles.
- Few returners. Under 5% of women in the workforce are flagged as returning to work.
For employers: move strong women from content, academic and counselling roles into product, implementation-lead and regional-sales roles, and open returner programmes. That addresses both the representation drop and most of the pay gap.
Does the degree pay?
An MBA/PGDM is the most valuable general credential in EdTech: its holders earn a median ₹9.5L, 1.7× other graduates, because it opens sales-leadership, product and business roles.
| Highest qualification | Median CTC (all levels) | 15+ years |
|---|---|---|
| PhD | ₹10.7L | ₹17.6L |
| MBA / PGDM | ₹9.5L | – |
| B.Tech / B.E. | ₹7.7L | – |
| Other postgraduate | ₹7.2L | – |
| B.Ed | ₹6.8L | ₹14.0L |
| Other graduate | ₹5.5L | – |
- Education degrees pay off at leadership level: B.Ed holders with 15+ years earn a median ₹14L and PhDs ₹17.6L.
- In the ₹50L+ tier, 64% hold an MBA/PGDM and 17% a B.Tech as their top degree; about one in five studied at an IIM, ISB or another top business school, and 12% at an IIT.
- For teachers and content specialists, a B.Ed or M.Ed is the entry ticket; moving into curriculum leadership, assessment or training is the escalator.
- Technology roles reward skills over degrees: B.Tech holders earn ₹7.7L overall, below MBAs, but senior engineers earn far more.
Location premium
Metros pay 1.2–1.4× the rest of India, mostly because of the roles they host; Mumbai has the highest median at ₹10.8L.
Median CTC by city (all levels)
| City | Median CTC |
|---|---|
| Mumbai | ₹10.8L |
| Gurugram | ₹10.0L |
| Noida | ₹9.3L |
| Pune | ₹9.0L |
| New Delhi | ₹8.0L |
| Bengaluru | ₹8.0L |
| Hyderabad | ₹7.5L |
| Patna | ₹5.8L |
| Kolkata | ₹4.8L |
Tier 1 premium by experience
| Experience | Tier 1 | Rest of India | Premium |
|---|---|---|---|
| 0–2 years | ₹4.4L | ₹3.6L | 1.22× |
| 3–7 years | ₹7.0L | ₹5.0L | 1.40× |
| 8–14 years | ₹9.3L | ₹8.0L | 1.16× |
| 15+ years | ₹15.4L | ₹12.2L | 1.26× |
Bengaluru's median is pulled down by its very large early-career pool, even though it has the most ₹50L+ earners. Like-for-like, the premium is narrower: for the same school-sales role, the Tier 1 premium is only about 1.05×.
Where the ₹25L+ earners live
| City (current location) | Share of all ₹25L+ earners | Share of the city's EdTech workforce |
|---|---|---|
| Delhi NCR (Delhi, Noida, Gurugram, Ghaziabad) | 31% | 5.7% |
| Bengaluru | 28% | 7.8% |
| Mumbai | 11% | 8.4% |
| Hyderabad | 7% | 4.4% |
| Rest of India and abroad | 23% | – |
At senior level the city gap widens: professionals with 8+ years in Tier 1 cities earn a median ₹11.5L (top 10% ₹40L+) against ₹5.4L (top 10% ₹18L+) elsewhere.
The ₹25L+ and ₹50L+ tiers
One in five active EdTech professionals earns ₹10L or more, one in 23 earns ₹25L+, and 1.1% earn ₹50L+, at a median of ₹61L.
Share of active EdTech professionals by annual CTC band
| CTC band | Share |
|---|---|
| ₹10–25L | 15.9% |
| ₹25–50L | 3.3% |
| ₹50L+ | 1.1% |
All ₹10L+ together: 20.3% of the workforce.
Where ₹25L+ pay comes from. In our senior deep-dive, the top quarter of engineering (₹36L+), product (₹42L+) and top-management (₹32L+) professionals with 8–14 years already sits above ₹25L. In sales, HR, marketing, data and content, crossing ₹25L usually takes 15+ years and a leadership title.
The ₹25–50L tier at a glance
| Measure | Value |
|---|---|
| Median CTC | ₹32L (middle half ₹28.9–38.6L) |
| Median experience | 11 years (middle half 8–16) |
| Education | B.Tech/B.E. 48%; MBA/PGDM 26%; IIM/ISB 7%; IIT 7% |
| Location | 87% in Tier 1 cities |
| Leading functions | Engineering, strategic & top management, product |
| Notice period | 32% join in 15 days, 34% in a month, 34% need longer |
An engineering-led market, reached about five years earlier than the ₹50L+ tier.
The ₹50L+ tier at a glance
| Measure | Value |
|---|---|
| Women | 20.7% |
| Median CTC | ₹61L (P25 ₹55L, P75 ₹72L, P90 ₹85L) |
| Median experience | 16 years (middle half 12–20); pay flat at ₹60–65L beyond 10 years |
| Current title | Director 30%; VP / AVP / GM 18%; CXO, founder or business head 18%; head of function 12%; other 22% |
| Leading functions | Strategic & top management, engineering, sales & BD, product |
| Where they live | Bengaluru ~36%; Delhi NCR ~36%; Mumbai ~12%; Hyderabad ~7%; Pune ~5%; Chennai ~3% |
| Education | MBA/PGDM 64%; B.Tech 17%; IIM, ISB or top B-school ~1 in 5; IIT 12% |
An MBA-led business-leadership market. Shares are directional.
Who employs them: large later-stage platforms and global education companies with Indian centres: upskilling and higher-education platforms, test-prep leaders and their digital arms, K-12 school-solutions groups, school-ERP and SaaS companies, and global ed-services and assessment firms. What it takes: almost every ₹50L+ profile owns a business outcome: a P&L, a product line, a large sales region or an engineering organisation. Most get here after 12–20 years.
Entry-level roles and expectations
Most people enter EdTech through a sales or counselling seat; median entry CTC across all functions is ₹3.9L (middle half ₹3–5.2L), and Tier 1 entry roles pay ₹4.4L against ₹3.6L elsewhere.
| Common entry role | What the work involves | Typical starting CTC |
|---|---|---|
| Academic / education counsellor | Inside sales to parents and students, mostly on calls; monthly targets | ₹3–5L + incentives |
| Business development associate (BDA) | B2C inside sales; the largest single entry route | ₹3.5–6L, often 60–70% fixed |
| Admission counsellor | Admissions for schools, colleges and test-prep centres | ₹2.5–4L |
| Teacher educator / academic mentor | Teacher training and classroom support for school-solution companies | ₹3–4.5L |
| Online tutor / subject teacher | Live classes or doubt-solving; often part-time or per hour | ₹2–4.5L |
| Content developer / SME | Writing questions, lessons and assessments | ₹2.5–4L |
| Engineering, data or product graduate | Software, analytics, associate product roles | ₹4–6.5L |
Ranges combine entry-band medians by function with recent hiring briefs.
- Candidates with up to two years' experience ask for a 35% median hike, the highest of any band, from a median current CTC of ₹5.0L.
- Women make up 48% of the entry pool, so entry roles are the easiest place to build a balanced team.
- Candidates increasingly ask about the fixed vs variable split, target realism and working hours before CTC.
The two-year question: the first move is the most valuable in a career (+54% from entry to mid-level median). Employers who do not refresh pay for top performers at 18–24 months lose them to this jump.
What candidates expect
Among active K-12 and EdTech job-seekers, the median candidate earns ₹9.5L and asks for ₹12L, a 28.5% hike.
| Segment (2024–26) | Median current | Median expected | Median hike asked |
|---|---|---|---|
| B2B school solutions: sales | ₹9.5L | ₹11.4L | 25% |
| B2B school solutions: academic & implementation | ₹11.9L | ₹15.0L | 26% |
| B2B school solutions: technology | ₹10.0L | ₹15.0L | 46% |
| B2B school solutions: content | ₹6.5L | ₹8.5L | 30% |
| Non-profit education: faculty (JEE/NEET) | ₹9.6L | ₹12.0L | 29% |
| Non-profit education: programme roles | ₹8.5L | ₹12.0L | 33% |
| School leadership (principal, academic head) | ₹11.2L | ₹14.5L | 29% |
| Corporate functions in B2B education firms | ₹15.0L | – | – |
| Corporate functions in non-profit education | ₹8.1L | – | – |
| All segments | ₹9.5L | ₹12.0L | 28.5% |
Do budgets meet expectations?
- 65% of candidates' expected CTC was at or below the employer's posted maximum.
- For sales and technology roles the figure drops to 58%; for shortlisted candidates it is 55%. The people employers want most are the most likely to be above budget.
- School-leadership roles carried budgets of ₹47–80L, far above what most applicants earned (median ₹11.2L): strong school leaders are scarce and few apply through open channels.
Why people move: career growth and a bigger role are by far the most common reasons; pay is the main reason for only about 3%. Relocation home, stability after layoffs and a shift from B2C to B2B are the other recurring themes.
Eight years of pay trends
Pay for the same K-12 and EdTech roles has moved sharply since 2017. The median candidate earned ₹5.4L in 2017–19 and ₹10L in 2022–26; school and EdTech sales pay doubled, from ₹5.5L to ₹11L.
Median current CTC by segment and period
| Segment (client type, anonymised) | 2017–19 | 2020–21 | 2022–24 | 2025–26 |
|---|---|---|---|---|
| K-12 school solutions (B2B) | ₹5.0L | ₹7.0L | ₹9.0L | ₹11.3L |
| Assessment company | ₹5.5L | – | ₹10.0L | – |
| Upskilling & higher education | – | ₹6.0L | ₹13.8L | ₹9.6L |
| All segments | ₹5.4L | ₹7.0L | ₹10.0L | ₹10.0L |
2023 is folded into 2022–24.
- Sales doubled. Regional business manager budgets moved from ₹3.5–6.5L (2018) to ₹10–13L plus 20% variable (2022); school-sales candidates now earn a median ₹11L.
- Technology more than doubled, then reset. Tech candidates went from ₹4.9L (2017–19) to ₹11L (2022–24), but budgets were cut after 2022.
- The 2020–21 spike. The pandemic boom pushed content and academic pay up fast; academic roles fell back after 2022 as B2C EdTech cut staff.
- Hike expectations are stable. The median hike asked is 30%; technology candidates ask 40%.
- Offer pay. Offers closed at a median ₹7.6L (middle half ₹6.3–10.6L).
Offers and budgets we have seen
Budgets are ceilings, not prices: in non-profit test prep a ₹12–18L budget closed at ₹7.5–10.8L, and B2C budgets were cut 15–30% mid-search after 2022.
| Segment | Role | Budget or offer seen (₹ lakh CTC) |
|---|---|---|
| Non-profit test prep | Master teacher, JEE/NEET | Budget 12–18; joined at 7.5, 9–10 and 10.8 |
| K-12 B2B curriculum | Curriculum associate / manager / SME | 6–10; senior SME 15; curriculum director 22.5 |
| K-12 B2B content | Senior editor (maths) / editor | 10.5 / 7 |
| K-12 B2B content | Partnership manager; account managers | 11; 7–10.5 |
| K-12 B2B curriculum | Inside sales (joined) | 13.5 |
| Assessment company | Full-stack engineer (offers) | 15–16.5 |
| Assessment company | Software engineer budgets | 12–30 in 2022; capped at 15–20 by 2024 |
| Assessment company | Relationship manager; zonal manager | 10.3 → 11.3 (10% hike); 14.4 |
| K-12 B2B sales (2018) | BDM / ABM / KAM | 3.5–6.5 / 6–9 / 8–11 |
| K-12 B2B sales (2022) | Regional business manager; regional content manager | 10–13 + 20% variable; up to 9 |
| School publisher | Senior sales officer; sales roles | 6.25; 3.8–8.7 |
| B2C live tutoring | Content developer | Budget cut from 11 to 8; joined at 6.5–6.9 |
| B2C live tutoring | Associate director, growth | Cap 50 |
| B2C kids' coding | Sales; team lead | Cap 9 (joined 3.6–10.5); TL 13 |
| B2C test prep | AGM, inside sales | 20 fixed |
| Study-abroad counselling | Regional programme manager | 15 fixed + commission; budget later cut to 13 |
Shown by segment so no client or candidate can be identified.
Candidates should negotiate on the role and the fixed component; employers should expect to close near the candidate's market median plus 20–30%.
The technology budget reset, one assessment company (₹ lakh)
| Role | 2022 budget | 2023–24 budget |
|---|---|---|
| Mobile / full-stack engineer (SDE) | 12–20 | up to 10–15 |
| Senior SDE | 25–32 | up to 18–20 |
| SDE 2 / SDET 2 | 20–30 | – |
| SDE lead | 30–36 | – |
| PHP / database engineer | 18–23 (senior) | up to 18 |
| Test engineer | – | 8–10 |
| Director, quality assurance | 30–40 | – |
| Product manager | 15–20 | – |
Recent budgets in upskilling and higher education (2024–26, ₹ lakh)
| Role | Budget |
|---|---|
| Associate director, region | 25 |
| Academic advisor (associate director level) | up to 35 |
| AVP, careers | ~28 |
| Regional manager, partnerships | 22 |
| Regional partnerships manager (study abroad) | up to 13 |
| Academic operations manager | up to 12.5 |
| Business development manager | 12 |
| Agent success partner; influencer manager; instructor | 8 |
| Academic counsellor (B2C, 2022) | 7–8 + incentives |
At the junior end, budgets for counsellors and instructors cluster at ₹7–8L; regional and academic leadership roles now carry ₹22–35L budgets.
Opportunities and talent scarcity
Demand in October 2026 is dominated by sales: of about 68,000 live EdTech-tagged job postings, most offer ₹3–10L and 95% are work-from-office (remote 3%, hybrid 1%). Delhi NCR, Mumbai and Bengaluru carry the most postings.
Notice period of active EdTech professionals
| Notice period | Share |
|---|---|
| 0–15 days | 57% |
| 1 month | 29% |
| 2 months | 7% |
| 3 months | 2% |
| More than 3 months | 2% |
| Currently serving notice | 4% |
Senior talent is slower: only 32% of ₹25L+ professionals can join within 15 days.
Live postings by salary band
| Salary band | Live postings |
|---|---|
| Up to ₹3L | 18,828 |
| ₹3–6L | 41,050 |
| ₹6–10L | 34,841 |
| ₹10–15L | 17,010 |
A posting can fall in more than one band; tagging is broad and includes some non-education employers.
Talent availability for niche K-12 roles
| Role | Talent availability |
|---|---|
| Instructional designer | Deep |
| PGT teacher | Moderate |
| TGT teacher | Moderate |
| Academic counsellor | Moderate |
| Curriculum developer / designer | Moderate |
| Psychometric / assessment | Moderate |
| JEE / NEET faculty | Limited |
| Coding teacher | Scarce |
| Special educator | Scarce |
| School counsellor | Scarce |
| Robotics / STEM educator | Scarce |
- New-curriculum skills. Coding, robotics/STEM and special-education roles are growing with NEP 2020 and NCF-SE 2023, but the experienced talent pool for each is still small. These roles need hiring from adjacent pools plus training.
- School counsellors are among the scarcest profiles we see.
- Senior specialists. There are roughly 14 senior sales professionals for every senior product manager in EdTech, and about 12 for every senior data professional.
- Instructional design is the deepest niche pool, so curriculum and digital-content teams can be built at reasonable cost.
Who employs EdTech talent
The employers that appear most often in our analysis fall into six groups.
| Employer type | Typical talent they hire |
|---|---|
| Test prep and K-12 learning platforms | Faculty, academic counsellors, inside sales, content, tech |
| K-12 school solutions | School sales, implementation, curriculum, teacher training |
| Kids' learning and tutoring | Tutors, inside sales, quality and operations |
| Upskilling and higher education | Counsellors, sales leadership, programme managers, product |
| Global education companies in India | Engineering, product, subject experts |
| Social-impact education | Programme managers, faculty, field operations |
B2B is the growth engine. As B2C EdTech consolidated, school-solution and school-SaaS companies became the most consistent hirers in our data, especially for school sales, implementation and curriculum roles. Their pay for sales and technology roles now matches or beats B2C.
What employers and professionals should do
For employers
- Price to the median plus 25–30%. That is what candidates ask and what moves them. Budgets set at the market median lose two in five shortlisted candidates.
- Fix the 18–24 month cliff. The entry-to-mid jump is +54%. Refresh pay for strong performers before they test the market.
- Hire school-facing roles locally. Tier 2 cities hold deep pools at a small discount for school sales and implementation.
- Budget separately for tech and product. Senior engineers and product managers earn about 3× senior sales, content or HR professionals.
- Build the women's pipeline at mid-career. Move strong women from content and counselling into product, implementation-lead and regional roles; run returner programmes.
- Sell the role, not just the CTC. Fewer than 1 in 30 applicants cites pay as the main reason to move.
- Plan for scarce skills. Coding, robotics, special-education and counselling talent must be developed, not just hired.
For professionals
- Make the first move count. The first switch, at two to three years, is the biggest pay jump of a career.
- After ten years, change scope, not just employer. Pay plateaus around ₹11L on tenure alone; P&L, product or region ownership breaks the ceiling.
- Use sales, product or tech as a bridge. They have the steepest pay curves and lead to the ₹25L+ and ₹50L+ tiers.
- Credentials help at specific points. An MBA opens leadership tracks; a B.Ed or PhD pays off in academic leadership.
- Negotiate the fixed component. Budgets are ceilings, and variable pay in sales can be 20–40% of CTC.
Outlook 2026–27: we expect increments of around 10% for stayers, 25–30% for movers, and the strongest demand in B2B school solutions, school SaaS, test prep and upskilling. Technology pay has reset after 2022 and is unlikely to return to boom-era budgets. The tightest markets will be senior leadership, product and new-curriculum skills.
Frequently asked questions
What is the average salary in EdTech in India in 2026?
Median CTC is ₹3.9 lakh at 0–2 years, ₹6 lakh at 3–7 years, ₹9 lakh at 8–14 years and ₹14.3 lakh at 15+ years.
Which EdTech roles pay the most?
At 8–14 years, product managers earn a median ₹27 lakh and engineers ₹24.5 lakh, about three times peers in sales (₹10 lakh), HR (₹7.5 lakh) or content (₹7 lakh).
What is the salary of an EdTech sales or academic counsellor?
Entry-level academic counsellors start at ₹3–5 lakh plus incentives and business development associates at ₹3.5–6 lakh. Senior sales professionals earn a median ₹10 lakh.
What hike do EdTech candidates expect?
The median hike asked is about 30%; technology candidates ask about 40%, and candidates with up to two years' experience about 35%.
Which city pays the most in EdTech?
Mumbai has the highest median at ₹10.8 lakh, followed by Gurugram (₹10 lakh) and Noida (₹9.3 lakh). Tier 1 cities pay 1.2–1.4× the rest of India.
Is there a gender pay gap in EdTech?
Yes. At the same experience, women earn 20–24% less than men. Women are 48% of entry-level professionals but 21% of those earning ₹50 lakh or more.
Methodology and limitations
- Combined sample. Figures come from 2.8 lakh+ candidate profiles and records (2017–2026) from Savanna HR's proprietary talent pool and leading job-board databases. Some professionals appear in more than one source.
- Estimates, not exact values. All figures are estimates of the typical market range. We do not claim 100% accuracy for any individual cut; smaller cuts are indicative.
- Self-reported pay. All CTC figures are declared by professionals or candidates and may include variable pay at target. Implausible values were removed; individual figures were not verified.
- Active profiles. Current-market figures cover professionals active in the last six months who list EdTech as their industry. This under-represents school teachers, who often do not, and over-represents people looking to move.
- Historical data has a B2B tilt. Historical records over-represent B2B school solutions, assessment, curriculum and non-profit education; B2C figures are mostly from 2018–2022.
- Gender gaps are unadjusted. They compare medians at the same experience band and do not control for function, city or employer.
- Job-posting tags are broad. Postings include some non-education employers using EdTech keywords; use the shares, not the totals.
Cite this report
Savanna HR Research (2026). K-12 & EdTech Compensation Benchmark India 2026. Savanna HR, Gurugram. savannahr.com
Hiring in K-12 or EdTech?
Savanna HR has hired for schools, school-solution companies, test-prep, upskilling and assessment firms since 2017. See our EdTech recruitment services or share your mandate for a free CTC benchmark for your role and city before you set the budget.


