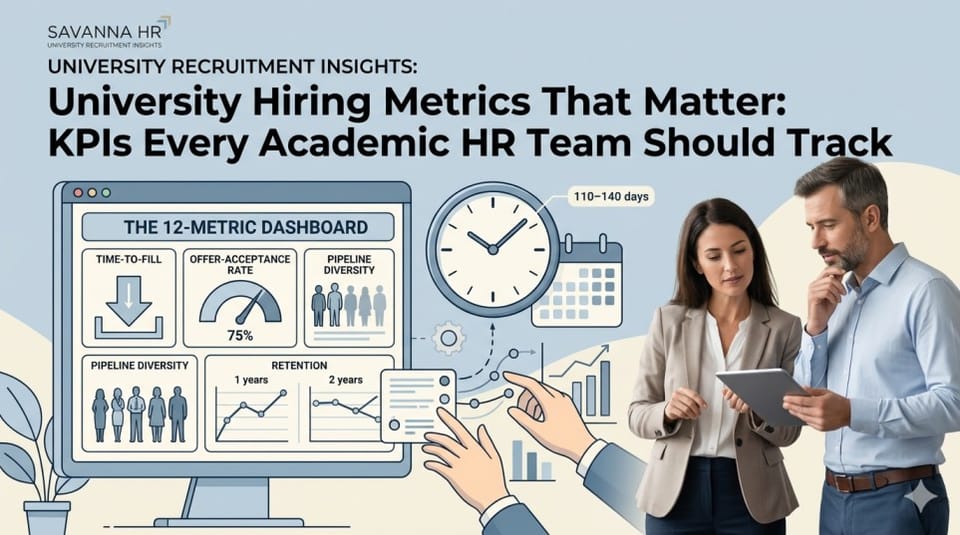
University Hiring Metrics That Matter: KPIs Every Academic HR Team Should Track
Why most universities cannot answer a basic hiring question
Try a small experiment. Ask your Dean of Faculty Affairs or Head of HR three questions: what was our median time-to-fill for faculty last year, what was our offer-acceptance rate by discipline, and what is our 2-year retention rate among new faculty hires. If you get clean, confident answers for all three in under five minutes, you are in the top 10% of universities globally. Most cannot answer even one.
That data vacuum is why so many university hiring conversations happen in circles. Leaders feel that hiring is slow, or offers are being lost, or new hires are leaving — but they cannot say by how much, where specifically, or whether last quarter was better or worse. Metrics are not bureaucracy; they are the minimum condition for actually managing a hiring function.
Here are the 12 metrics that matter most, with how to compute them, what good looks like, and how to act on each.
The 12-metric dashboard
1. Time-to-fill (median days, requisition to offer acceptance)
Formula: Days between requisition approved and candidate acceptance, across all filled roles in the period. Use median, not mean (means are skewed by outliers). Benchmark for Indian private universities: 110–140 days median is good, under 100 is excellent. For US R1: 180–240 is typical. Act on it: if above benchmark, pinpoint which phase (sourcing, interview, decision, documentation) consumes the most time.
2. Time-to-join (median days, requisition to start date)
Distinct from #1 — includes documentation, visa, relocation. Indian universities with international hires often see a 60–90 day gap between acceptance and joining. Tracking this separately surfaces onboarding bottlenecks.
3. Offer-acceptance rate
Formula: Offers accepted ÷ offers extended. Benchmark: 75–85% is healthy for Indian universities; 65–75% for US R1 tenure-track (more competitive). Below 60% is a red flag and usually indicates one of three issues: comp below market, slow process, or weak candidate experience.
4. Pipeline diversity at each stage
Formula: Share of under-represented candidates at applicant, shortlist, interview, offer, and hire stages. The useful signal is the delta across stages — where representation drops most sharply is where the process has the biggest leak.
5. Source-of-hire
Formula: Share of hires from each channel (referrals, job boards, conferences, executive search, internal, etc.). This is the foundation of every sourcing decision. Most universities are shocked when they first compute it — referrals often produce 35–50% of best-retained hires but receive 5% of the budget.
6. Interview-to-offer ratio
Formula: Candidates interviewed ÷ offers extended. Healthy range: 4–6 interviewed per offer. If ratio is higher than 8, interview bar may be too strict or candidates too weak; if under 3, the bar may be too low.
7. Cost-per-hire
Formula: Total recruitment spend (internal + external) ÷ number of hires in period. Benchmark for Indian faculty: ₹2.5–5L for mid-level, ₹8–15L for senior. For non-teaching: ₹1–3L typically. Useful for budget planning and comparing channels.
8. 1-year retention of new hires
Formula: Hires still employed 12 months after start ÷ hires in the period 12 months ago. Benchmark: 92%+ is healthy. Below 85% is a screening problem or an onboarding problem — usually both.
9. 2-year retention of new hires
The better quality signal. 1-year retention can be inflated by golden-handcuff contracts. 2-year retention reveals real hiring quality. Benchmark: 85%+ is healthy.
10. Time-to-productivity
Formula: Months from start date to first defined productivity milestone (first paper submitted, first grant applied for, first course delivered with positive feedback). Benchmark varies by role; the useful pattern is whether it is shrinking or growing year over year.
11. Candidate Net Promoter Score (cNPS)
Formula: Post-process survey of all candidates (offered and not). Score: % promoters − % detractors. Benchmark: +30 is good, +50 is excellent. A falling cNPS is a leading indicator of falling offer-acceptance in 6–12 months.
12. Hiring manager satisfaction
Formula: Quarterly 5-point scale survey of department chairs and committee chairs on satisfaction with recruitment partner/process. Benchmark: 4.2+/5.0. Declining scores signal friction with HR before it shows up in any other metric.
Consolidated benchmark table
| Metric | Indian private university | US R1 benchmark |
|---|---|---|
| Time-to-fill (median days) | 110–140 | 180–240 |
| Offer-acceptance rate | 75–85% | 65–75% |
| Interview-to-offer ratio | 4–6 | 5–7 |
| 1-year retention | 92%+ | 90%+ |
| 2-year retention | 85%+ | 82%+ |
| Cost-per-hire (faculty, senior) | ₹8–15L | $15K–$30K |
| cNPS | +30 to +50 | +25 to +45 |
| Pipeline diversity (offers stage) | 30%+ under-represented | 25%+ under-represented |
How to actually run this dashboard
The dashboard is only useful if it gets reviewed. The cadence we recommend:
- Monthly operational review. HR team + recruiting lead. Focus on in-flight metrics — pipeline volume, time-in-stage, offer outstanding. Tactical fixes.
- Quarterly strategic review. Dean / VP People, HR, representative faculty. Focus on outcome metrics — time-to-fill, offer-acceptance, diversity at stages. Process decisions.
- Annual board-level review. Full-year trends, benchmark comparison, investment priorities for next year. Links talent strategy to institutional strategy.
“We have been running this 12-metric dashboard for 18 months. Our time-to-fill dropped 34 days, offer-acceptance rose 17 points, and most importantly, we now have conversations about hiring based on evidence, not anecdotes.” — Chief People Officer, leading Indian private university
Common implementation mistakes
Three mistakes we see universities make in their first year of dashboarding. First, measuring too many things — more than 12 metrics and nothing gets acted on. Second, measuring without attribution — if you cannot trace a metric to a specific process lever, the metric is decoration. Third, publishing the dashboard without a decision cadence — metrics that do not feed decisions do not survive past the first quarter.
Getting started when you have no data today
Most universities start with nothing. Here is the minimum-viable version for month one:
- Pull the last 12 months of faculty hire dates and requisition dates; compute time-to-fill by hand.
- Pull offer logs for the last 12 months; compute offer-acceptance rate.
- Pull the last 12 months of hire list; check who is still employed — 1-year retention.
- Publish these three numbers. Review monthly. Expand the dashboard one metric per month.
Within 6 months, the full 12-metric dashboard is achievable. The universities that start now will be managing a data-driven hiring function by mid-2027 — just as the talent market gets structurally harder.
The bottom line
University hiring has historically been managed by intuition, anecdote, and committee memory. That model no longer works at the speed or scale the market demands. The universities that move to a data-driven hiring function — not bureaucratic, but evidence-based — will make better hires, faster, more fairly, and at lower cost. The ones that do not will spend the next decade wondering why their peers seem to hire so much better.
Savanna HR
Start managing faculty hiring with the same rigour you manage research.
Savanna HR builds hiring dashboards and KPI systems for universities — from baseline setup to quarterly reviews. Ask for our 12-metric university hiring dashboard template.